From Rules to Reality: How Human Movement Data is Advancing Trade Area Modeling
Introduction
Trade area modeling, a trusted practice in the retail and restaurant business for site selection and
sales forecasting, is in the early stages of a major revolution. It’s not the models themselves that
are changing – it’s the underlying data.
Trade area models are a set of mathematical equations that rely on the input of location-specific data to visualize and quantify potential revenue scenarios or to understand the impact of market events. They are designed to be flexible and to scale well. A good model can work for an entire region or a single store concept.
Trade area models have evolved from speculative, rules-based approaches to data-driven exercises. Now the biggest problem retailers face with modeling is the quality and accessibility of data. Models can accept a variety of data sources including: Point of Sales, store intercept studies, customer loyalty programs, government provided demographics, drive-time data, and in more recent years, beacon technology.
But each of these data sources has inherent drawbacks that have negatively impacted the cost and accuracy of trade area modeling.
Enter Human Movement Data
Human Movement Data is improving the accuracy of trade area modeling, and in turn, its effectiveness. It can be used as an alternative method or as a way to augment existing data strategies.
In the retail and restaurant world, incremental gains in business revenue make a big difference. If a business can improve the effectiveness of its trade area modeling by just a few percent points, that can mean a sizable increase in revenue, especially if the business has multiple locations.
Let’s take a look at the evolution of trade area modeling and how Human Movement Data is revolutionizing this historic tactic.
Trade area and site characteristics ultimately affect more than 50% of a retail location's revenue.
Other important factors include management, advertising, competition, and regional brand awareness.
The Pros and Cons of Existing Data Sources
Below are the datasets that are typically used to define trade areas and analyze customer data.
Sometimes businesses use multiple datasets to improve accuracy. While these sources are
well-known, widely used, and respected, they all have limitations that can be addressed with the
advent of mobile technology.

Point of Sales Data
Nearly every operational retailer or restaurant chain works closely with Point of Sales (POS) data to better understand its customer base and make key business decisions, and if they are not, they should be. Sales data is almost always used as a keystone in trade area modeling. However, it has fundamental drawbacks.
- It is not available for future locations. If you’re looking to build a predictive model for a new location, you obviously don’t have sales numbers for it.
- It’s nearly impossible to get sales numbers for your competition.
- It is difficult to match POS data to a geography to understand where customers are coming from. You can have sales associates ask for such things as address or ZIP Code, but this is time consuming and subject to human error. Plus, not all customers will feel comfortable sharing this information, and it’s actually illegal to ask for it in several states, including California and New Jersey.
- You can use credit card data to link a specific purchase to a specific location, but doing so is expensive, slow, not permissible in many circumstances, and will only match to the home residence of the cardholder, which isn’t helpful for locations that get a large proportion of their business from daytime traffic or people who work in the area.
Deterministic vs. Probabilistic Methods
Deterministic trade areas are based on known factors such as customer addresses or sales by geography, and they are defined by clear, unwavering boundaries, for example “a trade area is this 5-mile radius.”
Probabilistic trade areas are more flexible and consider additional factors. They visualize a customer’s likelihood to patronize the store based on things like location, drive-time, competitors, demographics, etc.

In-Store Intercepts
By conducting customer interviews, retailers and restaurants can ask in-depth questions and even link data to specific orders by using receipt numbers. The input can benefit a variety of business functions, including customer service, marketing, operations, product development, and of course, trade area modeling. But it has some inherent disadvantages.
- The interviews are expensive to run. Because of this, they are generally conducted for a small number of stores over a limited time period, so you end up with an incomplete dataset.
- They are disruptive to store operations and some customers find them intrusive. In an effort to increase participation rates, some businesses offer an incentive for completing the survey, such as a free food item. This can compromise data and add to the expense of the study.
- They take a long time to collect and analyze.
- The quality of the data is inconsistent and subject to the performance and integrity of the interviewer. There have been cases in which interviewers have blatantly made up information, or more commonly, inadvertently skewed results by only speaking to certain types of customers. Data integrity can also be comprised by consumers who provide incomplete or false information in an effort to please or speed along the process.
![]()
Customer Loyalty Programs
The usefulness of customer loyalty program data depends on the percentage of a business’s customers who are enrolled. Businesses can often link the data to other key events. For example, if program members use a coupon in-store, they can track what they purchased (and when) and note if they visit another store location. But this data has limitations, and because not all businesses have loyalty programs, they are simply not an option for many.
- They can be expensive to set up, market, and maintain, and it can be challenging to keep customers engaged after they have signed up.
- They are not a good fit for many brands, such as businesses that cater to one-time or infrequent purchases. Even when businesses have successful loyalty programs, they typically represent a limited percentage of their customer base, and these shopping patterns may not be indicative of the rest of their shoppers.
- While you can determine where customers shop, usually you can only link that data to their home address and not their place of employment or the trip pattern that affects their shopping decisions.
- This dataset is not designed with real estate in mind, so it can be hard to use for modeling.
Government Demographics
Businesses use government data to make informed assumptions about their customers. For example, they can better understand where they live, how much money they make, and if they have children. But this data is a proxy – it is not an exact representation of a population. It can help inform a trade model and serve as a starting point, but it doesn’t tell the whole story.
- It’s mostly modeled data extrapolated from sample sets.
- It is not always timely. For example, the U.S. Population and Housing Census is taken every 10 years.
- The data is a proxy and doesn’t represent an entire customer base or actual travel patterns. It is not empirical evidence.
- International data is not consistent in quantity or quality and varies greatly by country.


Different as Night and Day
Near used Human Movement Data to compare morning and late-night visitors in 18 popular quick-service restaurants across the U.S. We found some striking demographic differences. For example, in Dallas, Texas locations, the morning visitors had an average income that was almost $3,500 higher than their late-night counterparts.
In Hollywood, CA, morning diners' average income was almost $12,000 higher than nighttime diners. The takeaway? Government data can't tell you the full story. Mobile technology allows you to study the nuances of your customer base and to understand how patterns change over time.
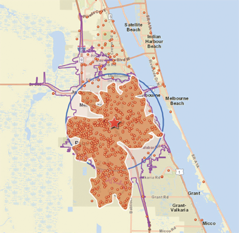
Trade Area Creation Methods
- The rules-based method is just as it sounds – based on specific rules in specific cases. For example, a suburban trade area is always a 5-mile drive distance, while an urban trade area is a 1-mile drive distance. They are easy to use but inflexible and can be widely inaccurate.
- The empirical method uses actual, verifiable data to draw conclusions.
- The modeled method uses statistics and existing data to make predictions based on empirical data
Drive-Time Data
Drive-time data helps businesses improve upon the radial method by calculating drive times from key locations. This type of analysis accounts for geographic barriers as well as speed limit. Digitized road data has increased the effectiveness of this mode. But, the drive-time method still cannot account for all of the factors affecting customer behavior.
- It is speculative, not empirical. Sometimes businesses use a rules-based approach to drive-time. For example, if it’s a dense urban area, let’s use a two-minute drive-time, but in suburban areas, let’s base our study on 12-minutes.
- It is inflexible and too generic. For example, not all QSR locations will have the same 7-mile drive-time.
- It is unintelligent and does not account for non-road based barriers such as perceptions about a neighborhood, real-world travel patterns, or the psychological impact of natural barriers, such as rivers, mountains, etc.

Beacon Technology
Beacons are devices that use Bluetooth technology to communicate with shoppers’ mobile devices to improve their experience and collect valuable information. They allow stores to track exactly who is shopping and glean valuable cross-shopping patterns, assuming consumers connect to beacons when they visit other locations. This tactic is contingent on people having a mobile device, and these days that’s the majority of customers.
- They can be difficult to set up and expensive to maintain.
- The data doesn’t easily lend itself to the geographical component of a trade area because you don’t know where a customer goes once he/she leaves your store. It’s an isolated dataset.
What’s Next
The marriage of beacon technology and mobile data can mean good things for businesses that can use this convergence to better understand in-store behavior and what happens once a customer leaves.
Radial/Radius Method
Despite extensive technology advances, this early approach to trade area modeling is still used today. Businesses define perimeters based on such factors as population, demographics, and mileage. For example, a company could determine it needs a location that has at least 40,000 people with incomes greater than $60k within a 5-mile radius.
The radial method is quick to perform and easy to digest, but it is certainly not exact. First off, it assumes that all trade areas are circular, and it doesn’t represent the way people actually shop. A customer might be more likely to visit a neighborhood that is 10 miles away than one that is closer because of traffic patterns, surrounding stores, or notions about the safety of the district. It can be a helpful filtering technique, but it doesn’t stand alone.
- It is oversimplified and doesn’t factor in traffic patterns, geographic barriers, or other factors influencing shopping behaviors
- It assumes all trade areas are circular, which just isn’t realistic.
- It does not account for competing businesses.

Say Goodbye to the Educated Guess
In trade area modeling’s infancy, people would literally write down the license plate numbers of cars in a business’s parking lot, match them to home addresses, and then manually map them out. Technology is powering trade area modeling methods that are more accurate, more scalable, and certainly less manual.
The Human Movement Data Advantage
The next step in the evolution of trade area modeling is real-world Human Movement Data, which allows businesses to analyze customers’ actual behavior, instead of making educated assumptions based on past actions or proxies.
A more accurate approach to understanding real-time shopping patterns
The data you gain from mobile devices isn’t modeled or extrapolated. It is based on actual actions. It is flexible and customizable enough to account for the nuances of customers’ shopping patterns. For example, businesses probably have varying foot traffic patterns on different days of the week or times of day. Human Movement Data lets you measure a precise moment in time to gain more accurate insights.
A superior approach to competitive analysis
It’s unlikely that a business can get its hands on a competitor’s POS data or in-store survey results. But with mobile technology, retailers can conduct in-depth analysis of the full competitive landscape.
Human Movement Data data can be used as a standalone modeling tactic or a supplement to other datasets. For example, perhaps a business chooses to do in-store intercepts for a handful of locations and to use mobile data for the rest. Then it can calibrate that data to glean more accurate insights about its current locations and potential sites.
The Benefits of Human Movement Data
- Low-cost at high scale
- Unbiased
- Accurate
- Flexible
- Real-time
- Non-proprietary
- Empirical

Not all Human Movement Data is Created Equal
Near uses GPS data, based on the actual latitude / longitude of a mobile device. This provides more accurate and comprehensive insights than other mobile data methods.
Some mobile data companies pull their reports from cellular data, which is dependent upon cell towers and is less reliable than Near's GPS-based approach. Others use in-car navigation cellular data, which doesn’t have comprehensive coverage since it is limited to when a customer is driving.
Human Movement Data In Action
Retailers and restaurants know that one of the most important factors in their success – or failure – is location. Human Movement Data can help them make better decisions about future sites, understand their existing sites and customers, analyze competitors, conduct cannibalization forecasts, and improve their marketing. This provides a competitive advantage that cannot be overstated. A business will find itself at a distinct disadvantage if a competitor is the only one using mobile data to improve its modeling.
Here are some common examples of how mobile data can help transform a retail or restaurant business.
Case Study 1: Trade Areas and Forecasts for Potential Stores
Single store trade areas and forecasts are the building blocks for site selection, gap analysis and Greenfield analysis, cannibalization studies, and other more comprehensive analysis.
Data is gathered, statistics are applied for marketing and site selection processes, and the potential of a location can ultimately be assessed.
While the approach and complexity of mathematics vary from model to model, the output is generally the same: a defined geographic draw area and an accompanying financial forecast number based on existing or expected knowledge of sales volume.
The financial forecast relies on:
a) POS data from existing locations
b) Secondary data fed into the model, including demographics, drive-time, store intercepts, and more
Inherent shortcomings in existing data sources have limited the accuracy of trade areas. Here is an example of an assessment of the proposed trade areas for an existing store location using three different methods.
Retailers use models to predict the size of a trade area, understand the demographics of its population, and forecast sales volume for prospective locations. Mobile data can improve site selection in a number of ways:
- Businesses can create predictive or prospective models based on models from existing locations.
- Businesses can get a more accurate understanding of cross-shopping behavior and how many locations a customer is visiting.
- When working with Near, businesses can analyze the co-tenant efficacy score to evaluate the impact of other brands.
Case Study 2: Cannibalization Study
Traditionally, cannibalization studies have looked at POS data for new and old locations and assigned transfer values. While this is useful for evaluating the “what,” it doesn’t explain the “where” or “when.” Mobile data can.
Here is an example of an actual study UM ran for a client, one of the nation’s largest QSRs.
In October 2014, the QSR opened a new location, Store A.
Using Human Movement Data, Near visualized Store A’s customers’ daytime and evening locations, as well as their paths into the store (path-to- purchase). We then compared these locations with data from customers of Store B, C, and D, both before and after the opening of Store A.

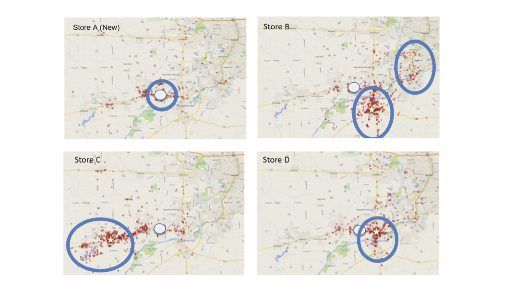
The data revealed that Store B and C were not negatively impacted by the opening. But Store D had the most overlap in path-to-purchase patterns with the new store and may have been negatively affected.
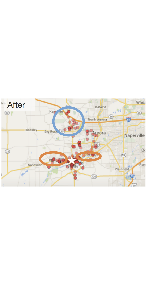
Near dug deeper using mobile data to determine the precise areas affected by the opening, right down to the specific roads for Store D, which was most impacted.
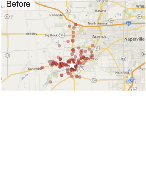
The area circled in blue experienced an increase in traffic to Store D after Store A's opening. The areas circled in orange experienced a slight decrease in traffic to Store D after Store A's opening. This level of detail simply cannot be obtained with older approaches to trade modeling.
Store D Before and After Store A Opening
Summary
The methods of yesteryear don’t take competitors into consideration. For example, a QSR might know they cannibalized themselves by opening an additional location, but they don’t know how this opening affected their competitor, or how much lift a competitor saw when it opened a new store.
In the past, retailers’ abilities to estimate the effects of competition were limited. They could use just the presence and location of competitors or estimate their trade areas using radial or drive-time methods. But Human Movement Data provides empirical data for determining the true trade areas of competing brands.
A business can calculate its trade area before and after an event, such as the opening of a competing store. They can also use mobile data to analyze cross-shopping behavior to see what percentage of customers shop at competitive locations. Human Movement Data users can get quite granular with their data and begin to understand which retailers are stealing their existing customers. They can even use this information to design conquesting campaigns in which they serve mobile ads specifically to their competitors’ customers, further drawing on mobile data’s unique applications.
Because businesses have this new and improved understanding of their customers and an enhanced ability to find them at a particular place and time by targeting their mobile devices, Human Movement Data can be used to improve their marketing efforts.