Methodology
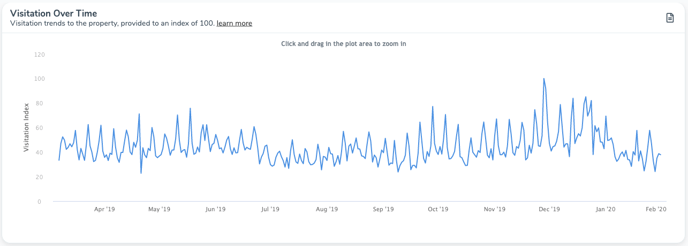
The Visitation Over Time chart presents a line graph of historic day-by-day trends to the property. This allows you to understand when visitation to the location has gone up or down. Please note that due to the method in which the data is processed for this report, the data is only available up to the previous month.
Visitation Over Time is generated by analyzing mobile visit observations for a location over a span of time and applying a statistical model that estimates the level of visitation. These estimated visitors are then translated to a visitation index (not raw visitor counts) to assess relative change in foot traffic over time.
🔎Do you have more questions about this chart? Read our article on our Heartbeat Report or contact our support team!