Customize a Report to Reflect Your Brand's Image
How to Customize the Colors in a Report
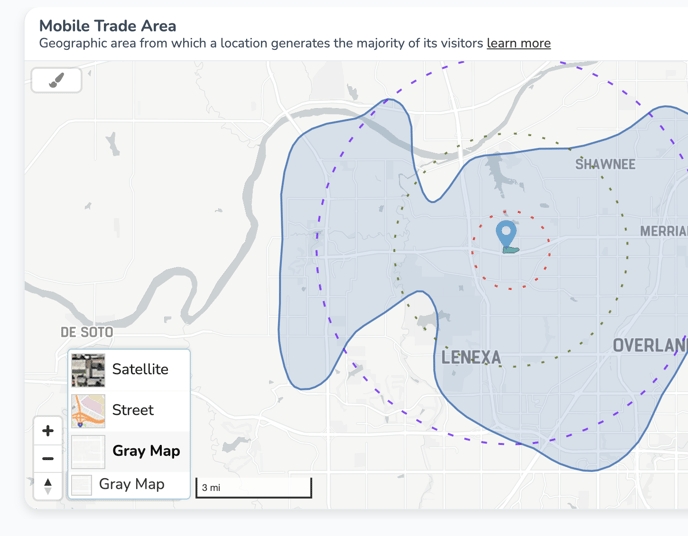
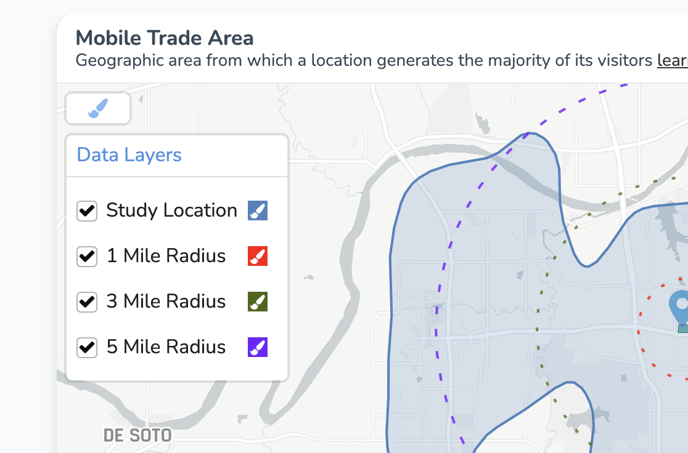
The colors of your results, as well as the 1-3-5 mile radius rings, can be customized by clicking on the paintbrush icon in the top left of the chart.
HEX Color Code Selection
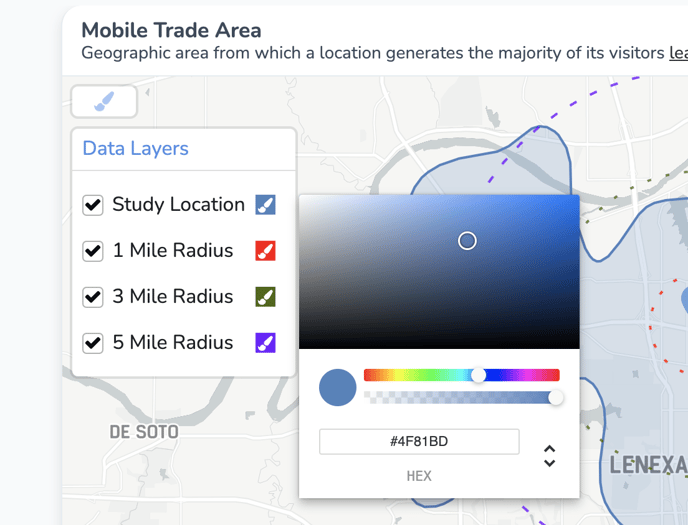
Click on the paintbrush to the right of your selection to launch the customization tool. You will be defaulted to a HEX color code selection.
HSLA Color Codes
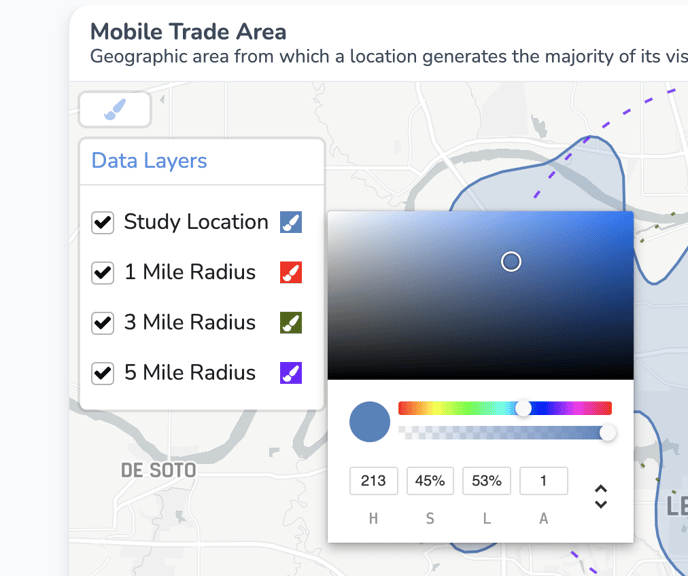
If you click on the downward arrow to the right of the default HEX code, you will have the option to enter your color scheme using HSLA color codes.
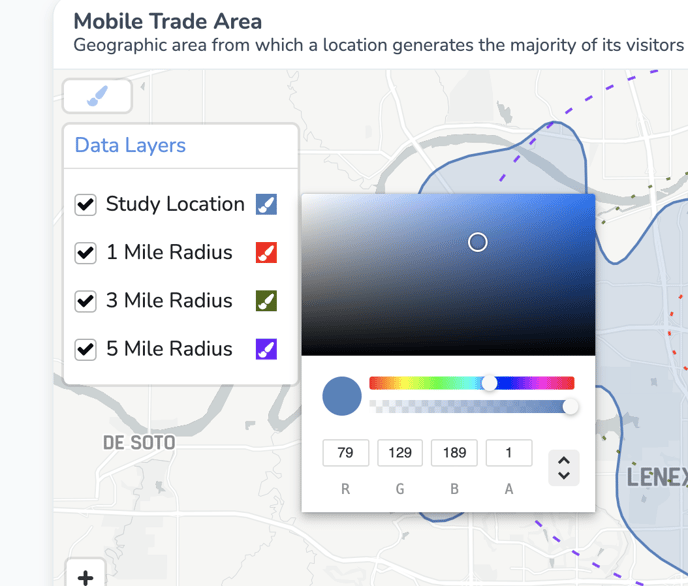
RGBA Color Codes
If you click on the downward facing arrow 2 times from the default, you will have the option to enter your color scheme using RGBA codes.
How to Customize the Map Style in a Report
The map style of your report can be customized using the map selector in the bottom left of your chart.