Using the Retail Heartbeat report, this analysis explores the impact that a national promotion had on foot traffic to a major brand's stores, and compares that to its competitor during the same timeframe.
Table of Contents

What is Heartbeat?
Heartbeat is a visitation trend report that provides a baselined estimate of visitors to the study location(s), developed to offset the rising observability of mobile devices. The Heartbeat report uses various data supply sources to provide a stable estimate of visitation over the time frame analyzed. More information on the Heartbeat report can be found in this article.
Overview & Methodology
Overview
Using Near's Human Movement Data, this analysis explores the impact that the promotion had on foot traffic to this national brand's stores in 2019, and compares that to its competitor during the same timeframe.
Methodology
Use Retail Heartbeat to compare foot traffic trends throughout the promotion period time frame of both the national brand and its competitor's stores.
Study Sites
Competitor locations- 2,296 sites
Brand locations- 2,281 sites
Timeframe
February 6, 2019 - May 7, 2019
Measures of success
- How did foot traffic change for this brand and their throughout the promotion period?
- At what points during the promotion did each brand experience the most change in foot traffic?
Insights & Findings
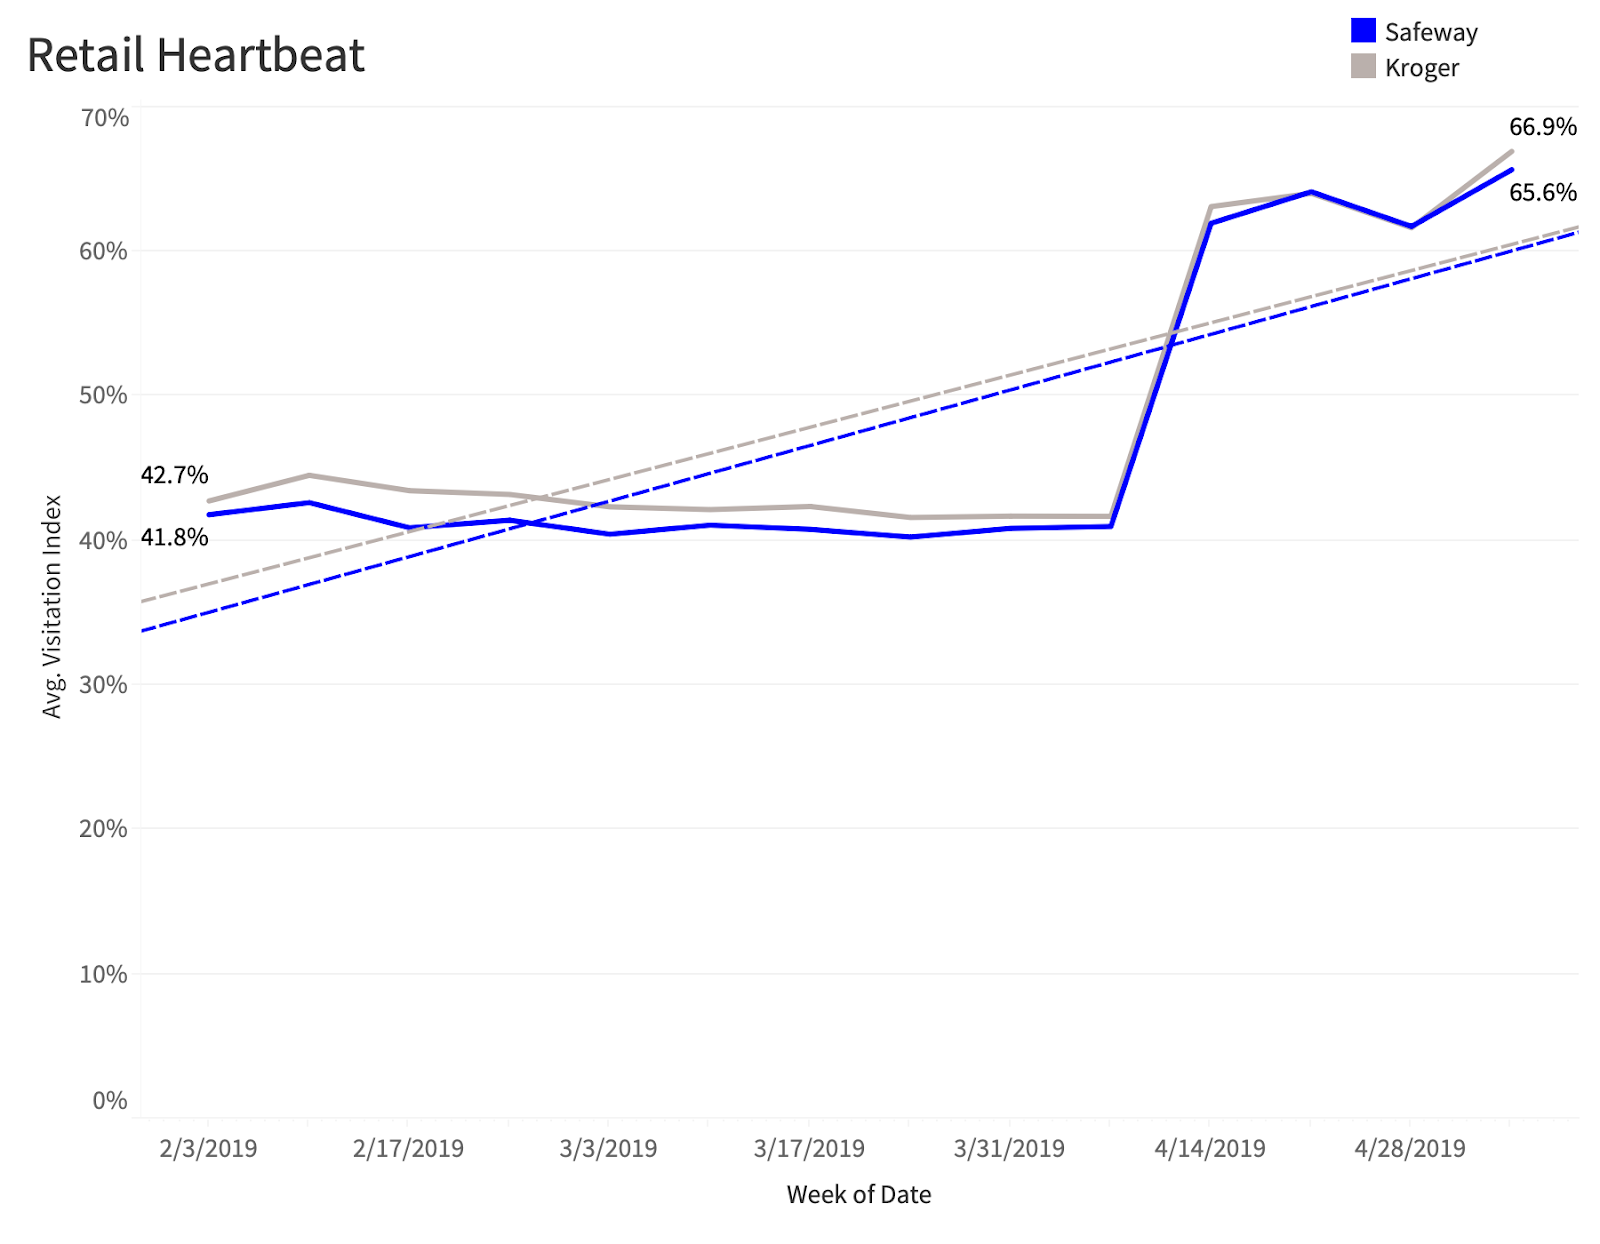
How has foot traffic changed during the promotion?
- Foot traffic to both brands increased during the timeframe of the promotion.
- Brand's visitation had higher rate of growth than their competitors.
- Large increase in visitation for both brands in the spring.
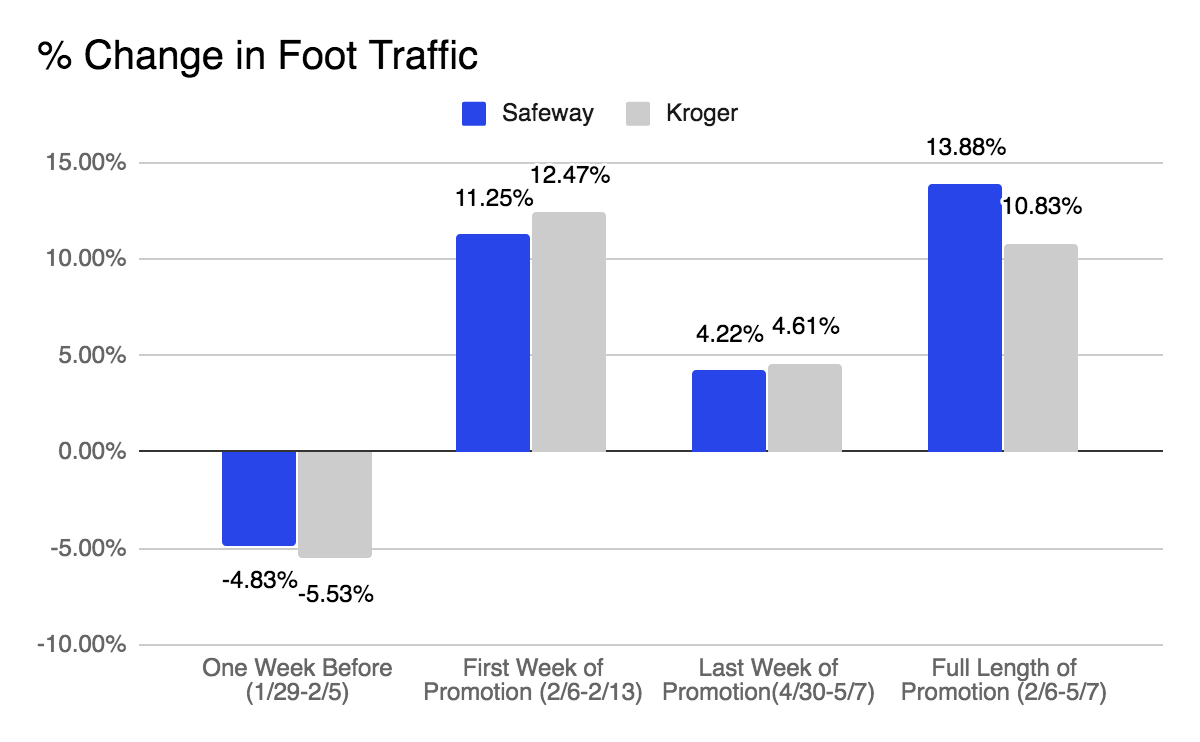
At what time did foot traffic change the most?
- Both brands experienced a decrease in foot traffic a week before the promotion.
- The first week of the promo coincided with Superbowl Sunday, where each brand had an increase in foot traffic.
- Although competitor had slightly more growth in foot traffic on the first and last week, brand had a higher rate of overall growth during the timeframe.
Conclusions
- The promotion is correlated with an overall increase in foot traffic for the brand's stores.
- Although the competitor also experienced growth in foot traffic during the same timeframe, the brand had 3% more growth.
- Increases in foot traffic were also correlated to seasonal events such as Super Bowl Sunday.
About the Author
Grant is an expert in data science and statistics. He cares about translating data to create actionable insights, and wants to help you do the same.