An Explanation of a Vista Insights Report in 90 Seconds
Visitation Heatmap
.png?width=688&name=Visitation%20Heatmap%20(2).png) The Visitation Heatmap shows visitor density within a location.
The Visitation Heatmap shows visitor density within a location.
Having this unique bird's eye view helps you identify commonly visited areas within a property during a particular time period. This is great for retailers interested in managing merchandising and store experience, and also gives real estate professionals insight into well-performing tenants in shopping centers.
Visitation Over Time
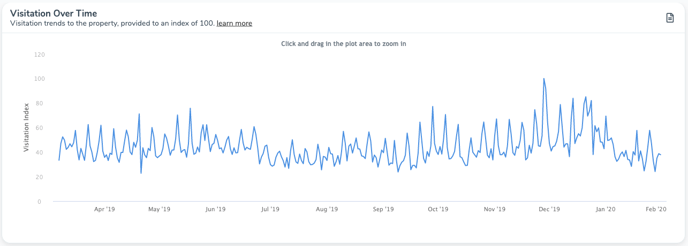
The Visitation Over Time chart helps you understand upward or downward visitation trends.
This chart uses the most visited day of the time frame and uses that to plot out all other days' visitation, in relation to the most popular day. This metric is provided as an index value, not visitor counts. This chart can be used to study the effectiveness of a promotion, assess the health of a retail or restaurant location over time and more. Please note this report is only available for US locations a month at a time, so the time frame may not exactly match what you designate.
Visitation Times - Day of Week and Time of Day
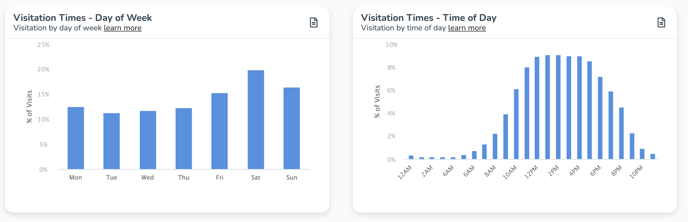
These charts helps you identify peaks and valleys of visitation by day of week or time of day.
These insights are produced by referencing the timestamp of the visit and can assist with determining staffing levels, advertising effectiveness and operational efficiencies.
Mobile Trade Area
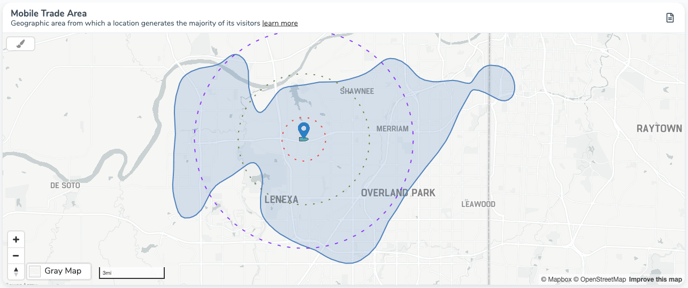
This shape is your location's trade area based on the origin points (more on this below) and routes taken by your visitors.
The trade area is created by using a combination of visitors' common evening location, common daytime location and pathing data to form a unique shape. 1-3-5 mile radius rings are provided for reference and scale. This is powerful for understanding possible store cannibalization, site selection and competitive analysis.
Origin Points - Common Evening Location
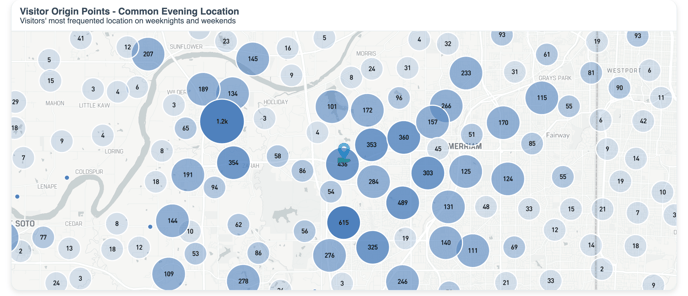
This chart demonstrates where visitors to your location spend time during nights and weekends, a proxy for a home location. These are feeder markets to your location and can be used for trade area, cannibalization and store opening/closure analyses.
Origin Points - Common Daytime Location
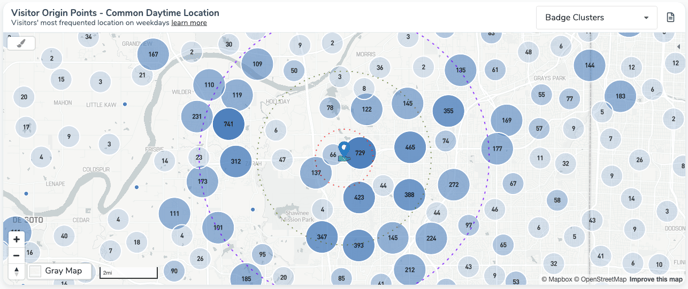
This chart demonstrates where visitors to your location spend time during weekday during work hours, a proxy for a work location. These are feeder markets to your location and can be used for trade area, cannibalization and store opening/closure analyses.
Pathing
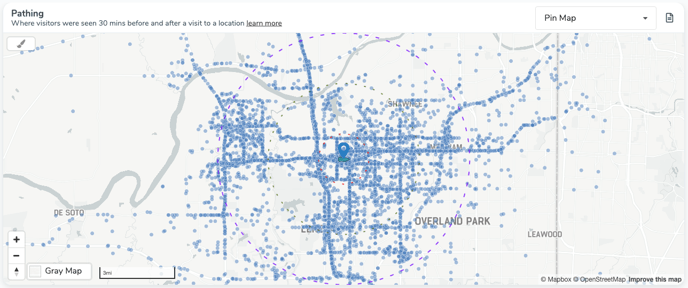
This chart reveals the routes and paths visitors take to your location.
This is done by plotting where visitors are seen 30 minutes before and after a visit to your location. This can help you understand common routes and the customer journey to and from your location.
Demographics
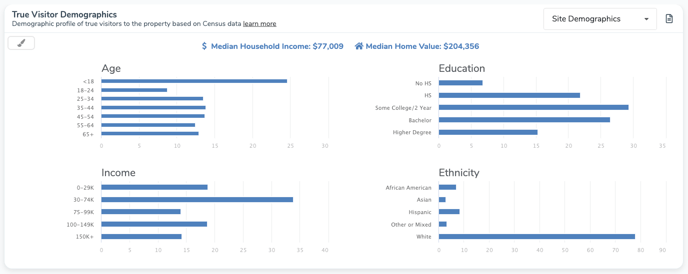
This chart helps you understand the socio-economic makeup of your visitor.
This chart provides household-level demographics on visitors to your location based on their common evening location, and how they compare against the region (DMA) and country.
❓Have a question about anything you see here? Contact our support team for guidance and advice.